
Dashboard of a service in SWPanel
Detailed Service Dashboard Manual for SWPanel
1. Introduction and overview of the manual
This manual is designed to offer a complete, detailed and comprehensive guide to the use of the Dashboard within SWPanel, the cloud services and web hosting management platform. In computing, a Dashboard is a visual tool that allows the user to quickly access key metrics and functions related to their services. In the case of SWPanel, the Dashboard plays a fundamental role in the administration of services such as Cloud servers, Hosting plans, domains, FTP accounts, among others.
What will you find in this manual?
Throughout this document, the following are explained in depth:
- The functionalities of the Dashboard for a Cloud server.
- The functionalities of the Dashboard for a Hosting service.
- The options available in each section.
- The use of each tool available from the Dashboard view.
- Important concepts for understanding and taking advantage of all the system's functionalities.
2. Cloud service dashboard
Accessing the Cloud Dashboard
To access the Dashboard of your Cloud server, use the service search bar at the top of the SWPanel. Type in the name of the server and click on it:
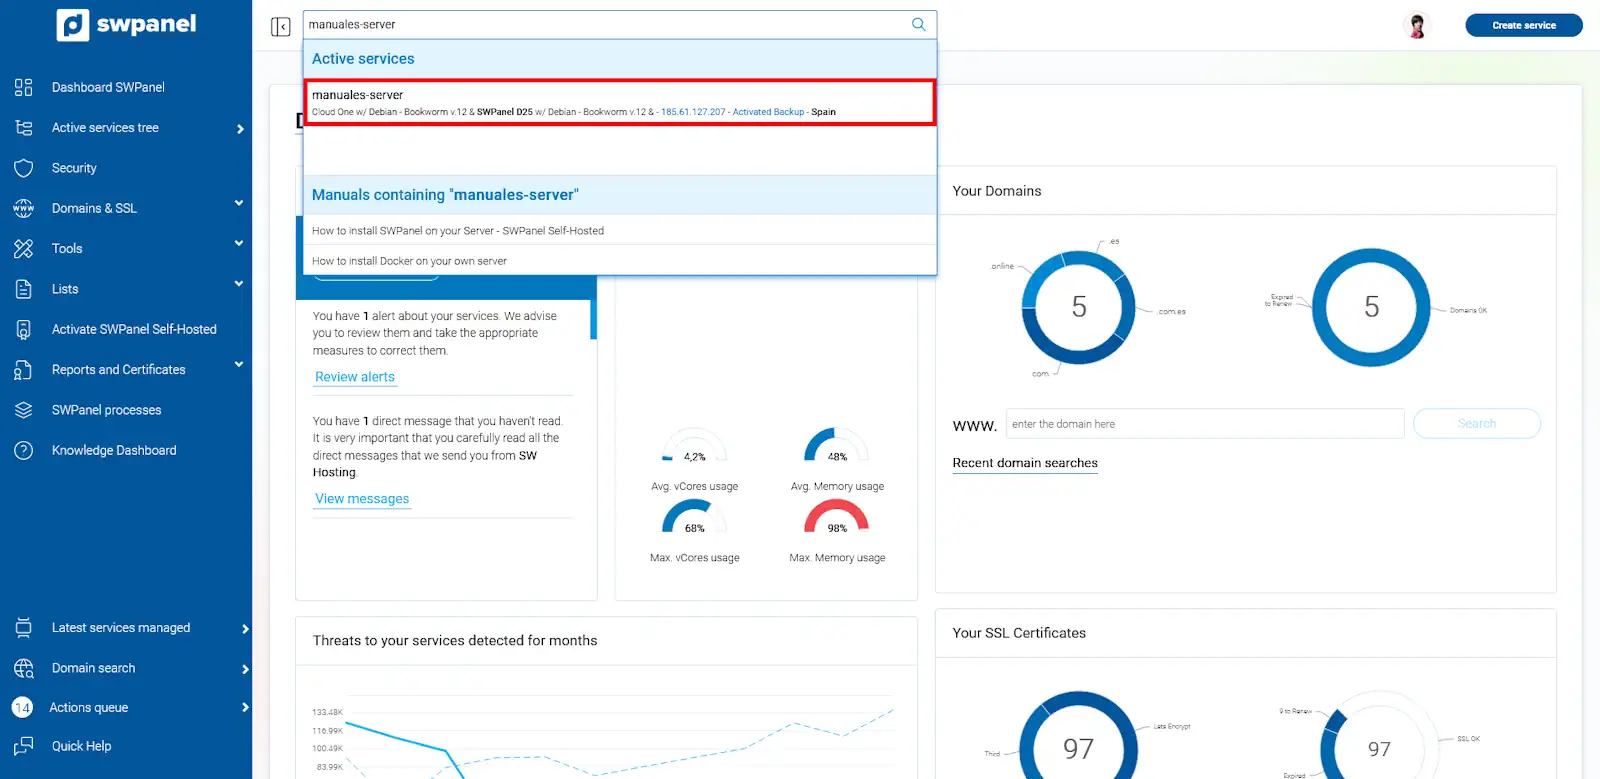
info_capture The screenshot is for guidance purposes. It was taken on version 2025.03.0007 dated 12/04/2025. It may differ from what the current version of SWPanel shows
Once inside, the Cloud server Dashboard is presented, organized into information blocks:
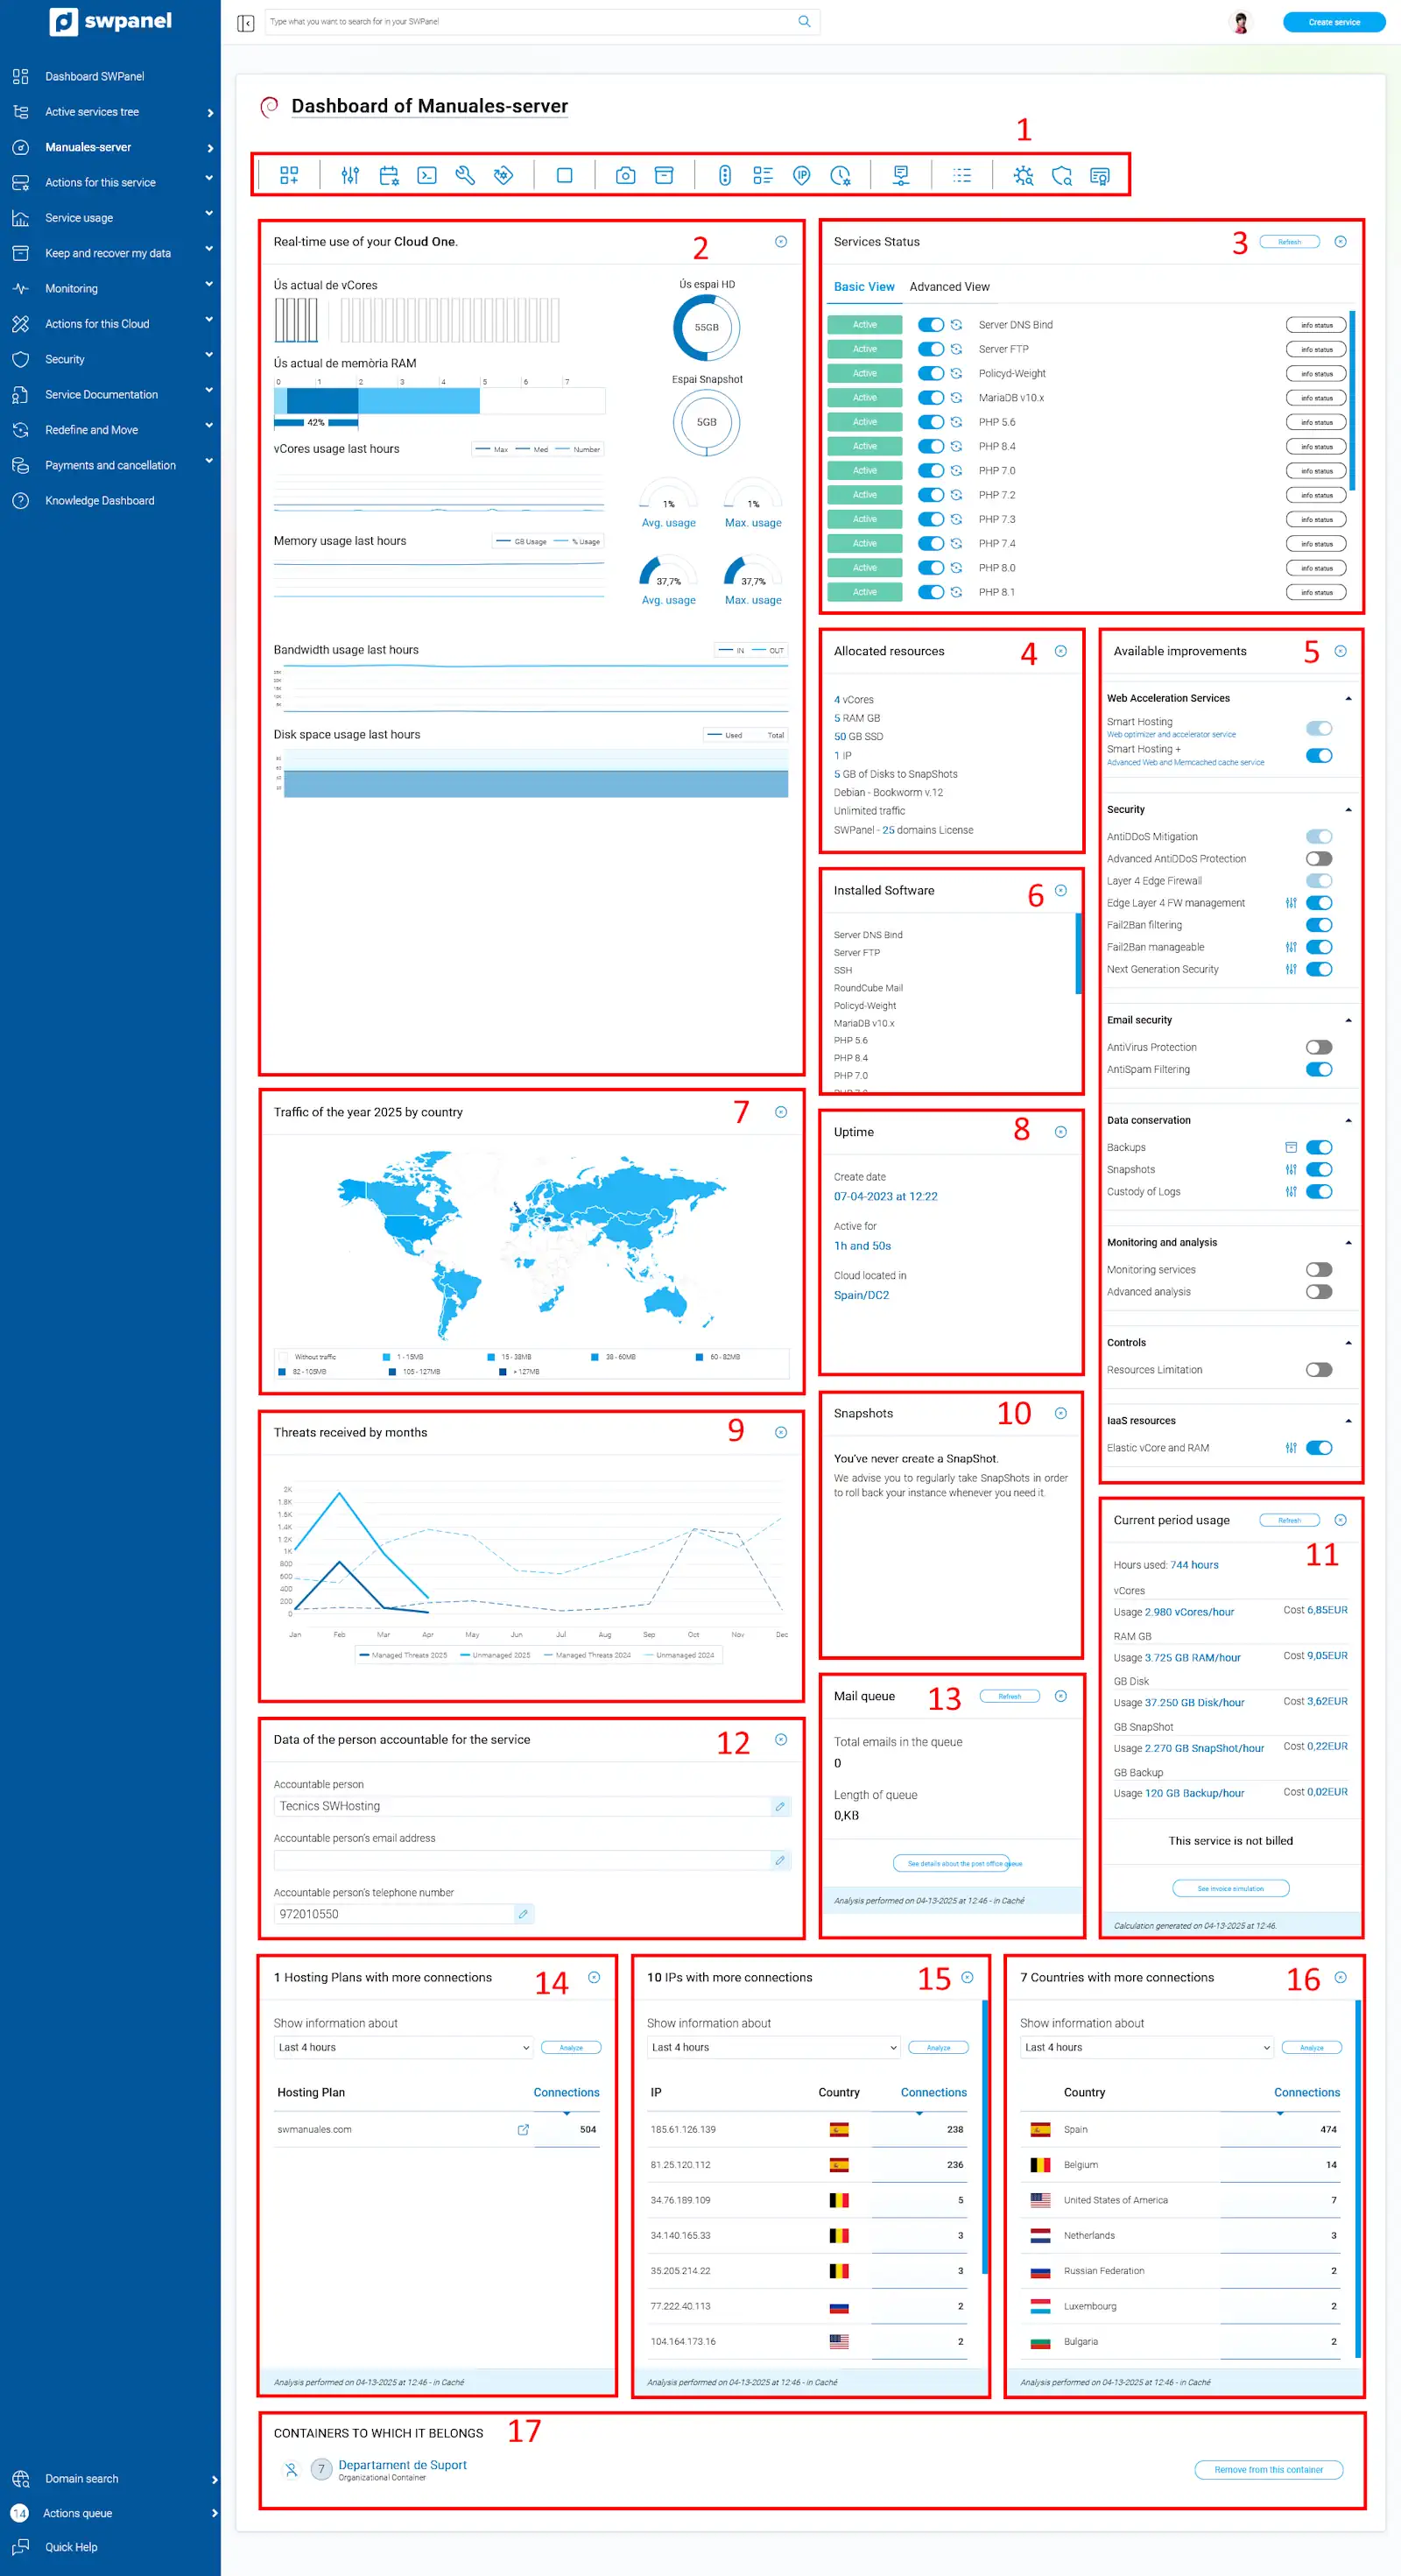
info_capture The screenshot is for guidance purposes. It was taken on version 2025.03.0007 dated 12/04/2025. It may differ from what the current version of SWPanel shows
Cloud Dashboard blocks
1. Icons for specific functions and Cloud configuration
In this block you will find the icons corresponding to the following functions:
-
Create a new service in this accumulator: This is a shortcut to create a new Web Hosting, Redirector or Email service.
-
Customize and adjust the resources and services of this Cloud: To modify all the resources assigned to your cloud, you can also modify the different extras available.
-
Create a planned scaling for this Cloud: To define the increase or reduction of resources in a scheduled time.
-
Open Console: To access your Cloud from SWPanel via SSH, and be able to execute any necessary command.
-
Adjusting the basic service parameters: To define the configuration of the different services installed in the cloud.
-
Manage updates to the operating system, software and installed services: To define the updates to your cloud server, whether you want them to be automatic, to carry them out manually, etc.
-
Start / Stop the Cloud: To start or stop the cloud depending on its status, in the stop section, you can choose between normal or forced.
-
Take a Snapshot: To create an image of the current status of your Cloud.
-
Backup Dashboard: To define the backup of your hosting as well as the different directories that are in your Cloud.
-
Access the permissions manager: To manage the read/write permissions of your Cloud server.
-
Access the file manager: To explore and perform actions directly on the directories and files of your Cloud.
-
Manage the IPs associated with your Cloud: To consult your IPs, the subnet mask, manage the DNS records and modify the PTR record. ? Manual: ##título##
-
Cron management: To create different crons and define when you want to execute them.
-
Timeline of actions on this service: To see all the actions that have been carried out on the service, ordered by the day they were executed.
-
Log Management: To view the different system logs (PHP, FTP, Syslog, Kernel...).
-
Activate Layer 4 FW Management: To activate the layer 4 firewall of your Cloud.
-
Usage History: To view the usage history of all the resources in your Cloud.
-
About system vulnerabilities: To generate a report of the different vulnerabilities detected in your system.
-
Next Generation Security Analysis: To request a Cybersecurity report of your Cloud server.
-
Issue a certificate for this service: To generate a certificate of the location of the data as well as the ISO27001 data protection certificate.
2. Resource usage summary
Real-time display of resource consumption such as CPU (vCores), RAM, disk and bandwidth.
3. Service status
Shows whether the main services (web, email, database, etc.) are active or stopped. Allows you to manage their status.
4. Allocated resources
Detailed list of contracted resources (CPU, RAM, disk, etc.).
5. Available upgrades
Extras that can be activated or deactivated as required.
6. Installed software
Summary of the operating system and the software that is currently installed.
7. Traffic by country
Report on the geographical origin of the traffic received by the server during the year.
8. Uptime
Time that the server has been running since its last activation.
9. Threats received by month
Monthly graph showing the threats detected, treated and not treated.
10. Snapshots
List of status copies made on the server.
11. Current use of the service
Information on current use and estimated cost, with option to simulate invoice.
12. Details of the person responsible
Contact details of the administrator responsible for the service.
13. Mail queue
Emails pending dispatch and space they occupy on disk.
14. Hosting plans with the most connections
Display of which hosted services generate the most traffic.
15. IPs with the most connections
IP addresses that have made the most connections to the Cloud services.
16. Countries with the most connections
Geographical distribution of the origin of connections to the server services.
17. Organizational containers
Hierarchical classification of the server within SWPanel.
3. Hosting service dashboard
Access to the Hosting Dashboard
As with the Cloud service, search for the name of your Hosting service in the top bar of SWPanel and click on it:
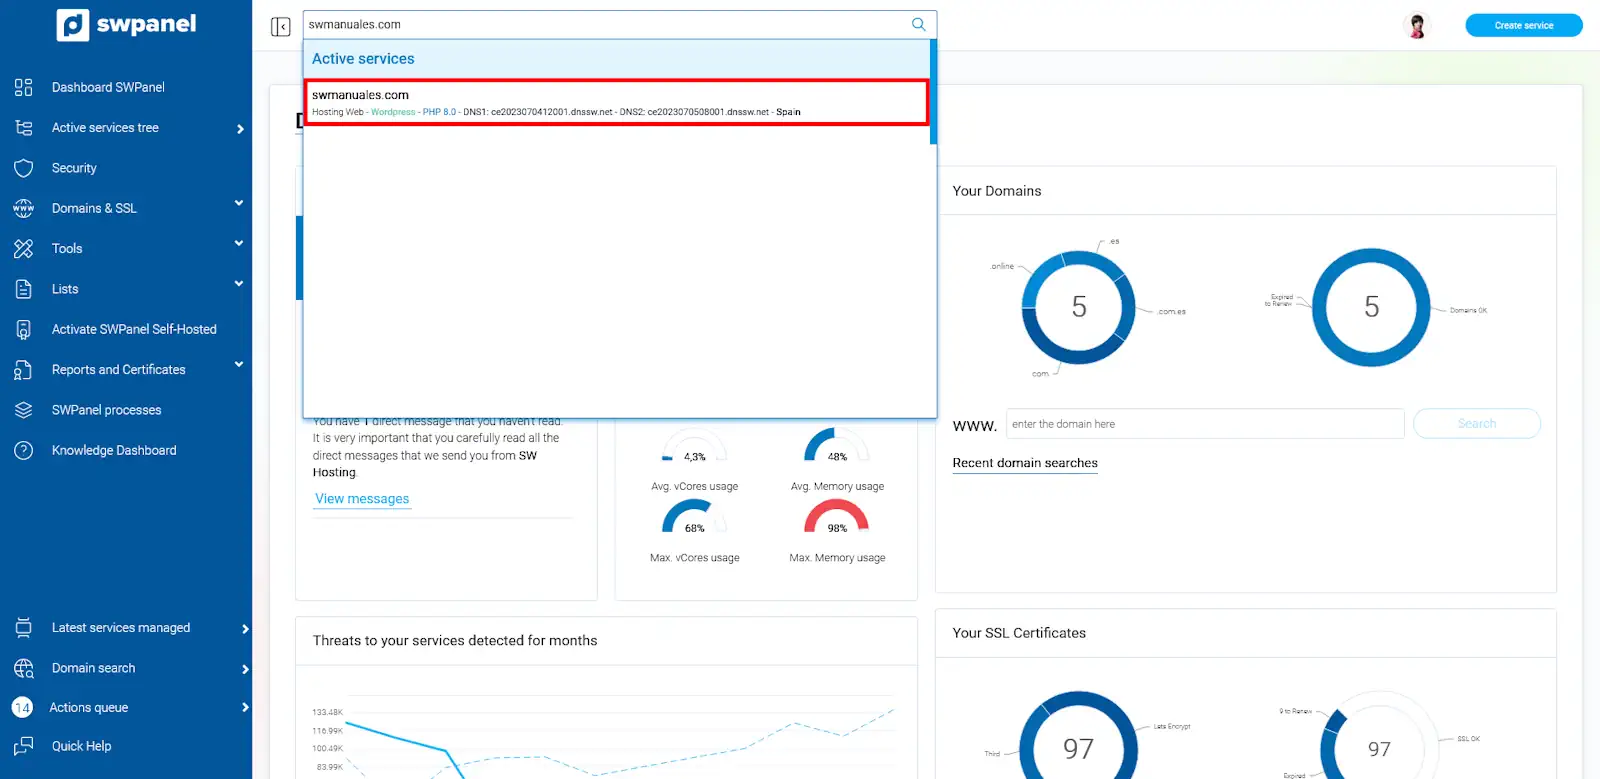
info_capture The screenshot is for guidance purposes. It was taken on version 2025.03.0007 dated 12/04/2025. It may differ from what the current version of SWPanel shows
Once inside, you access a screen with specific functionalities of the Hosting service:
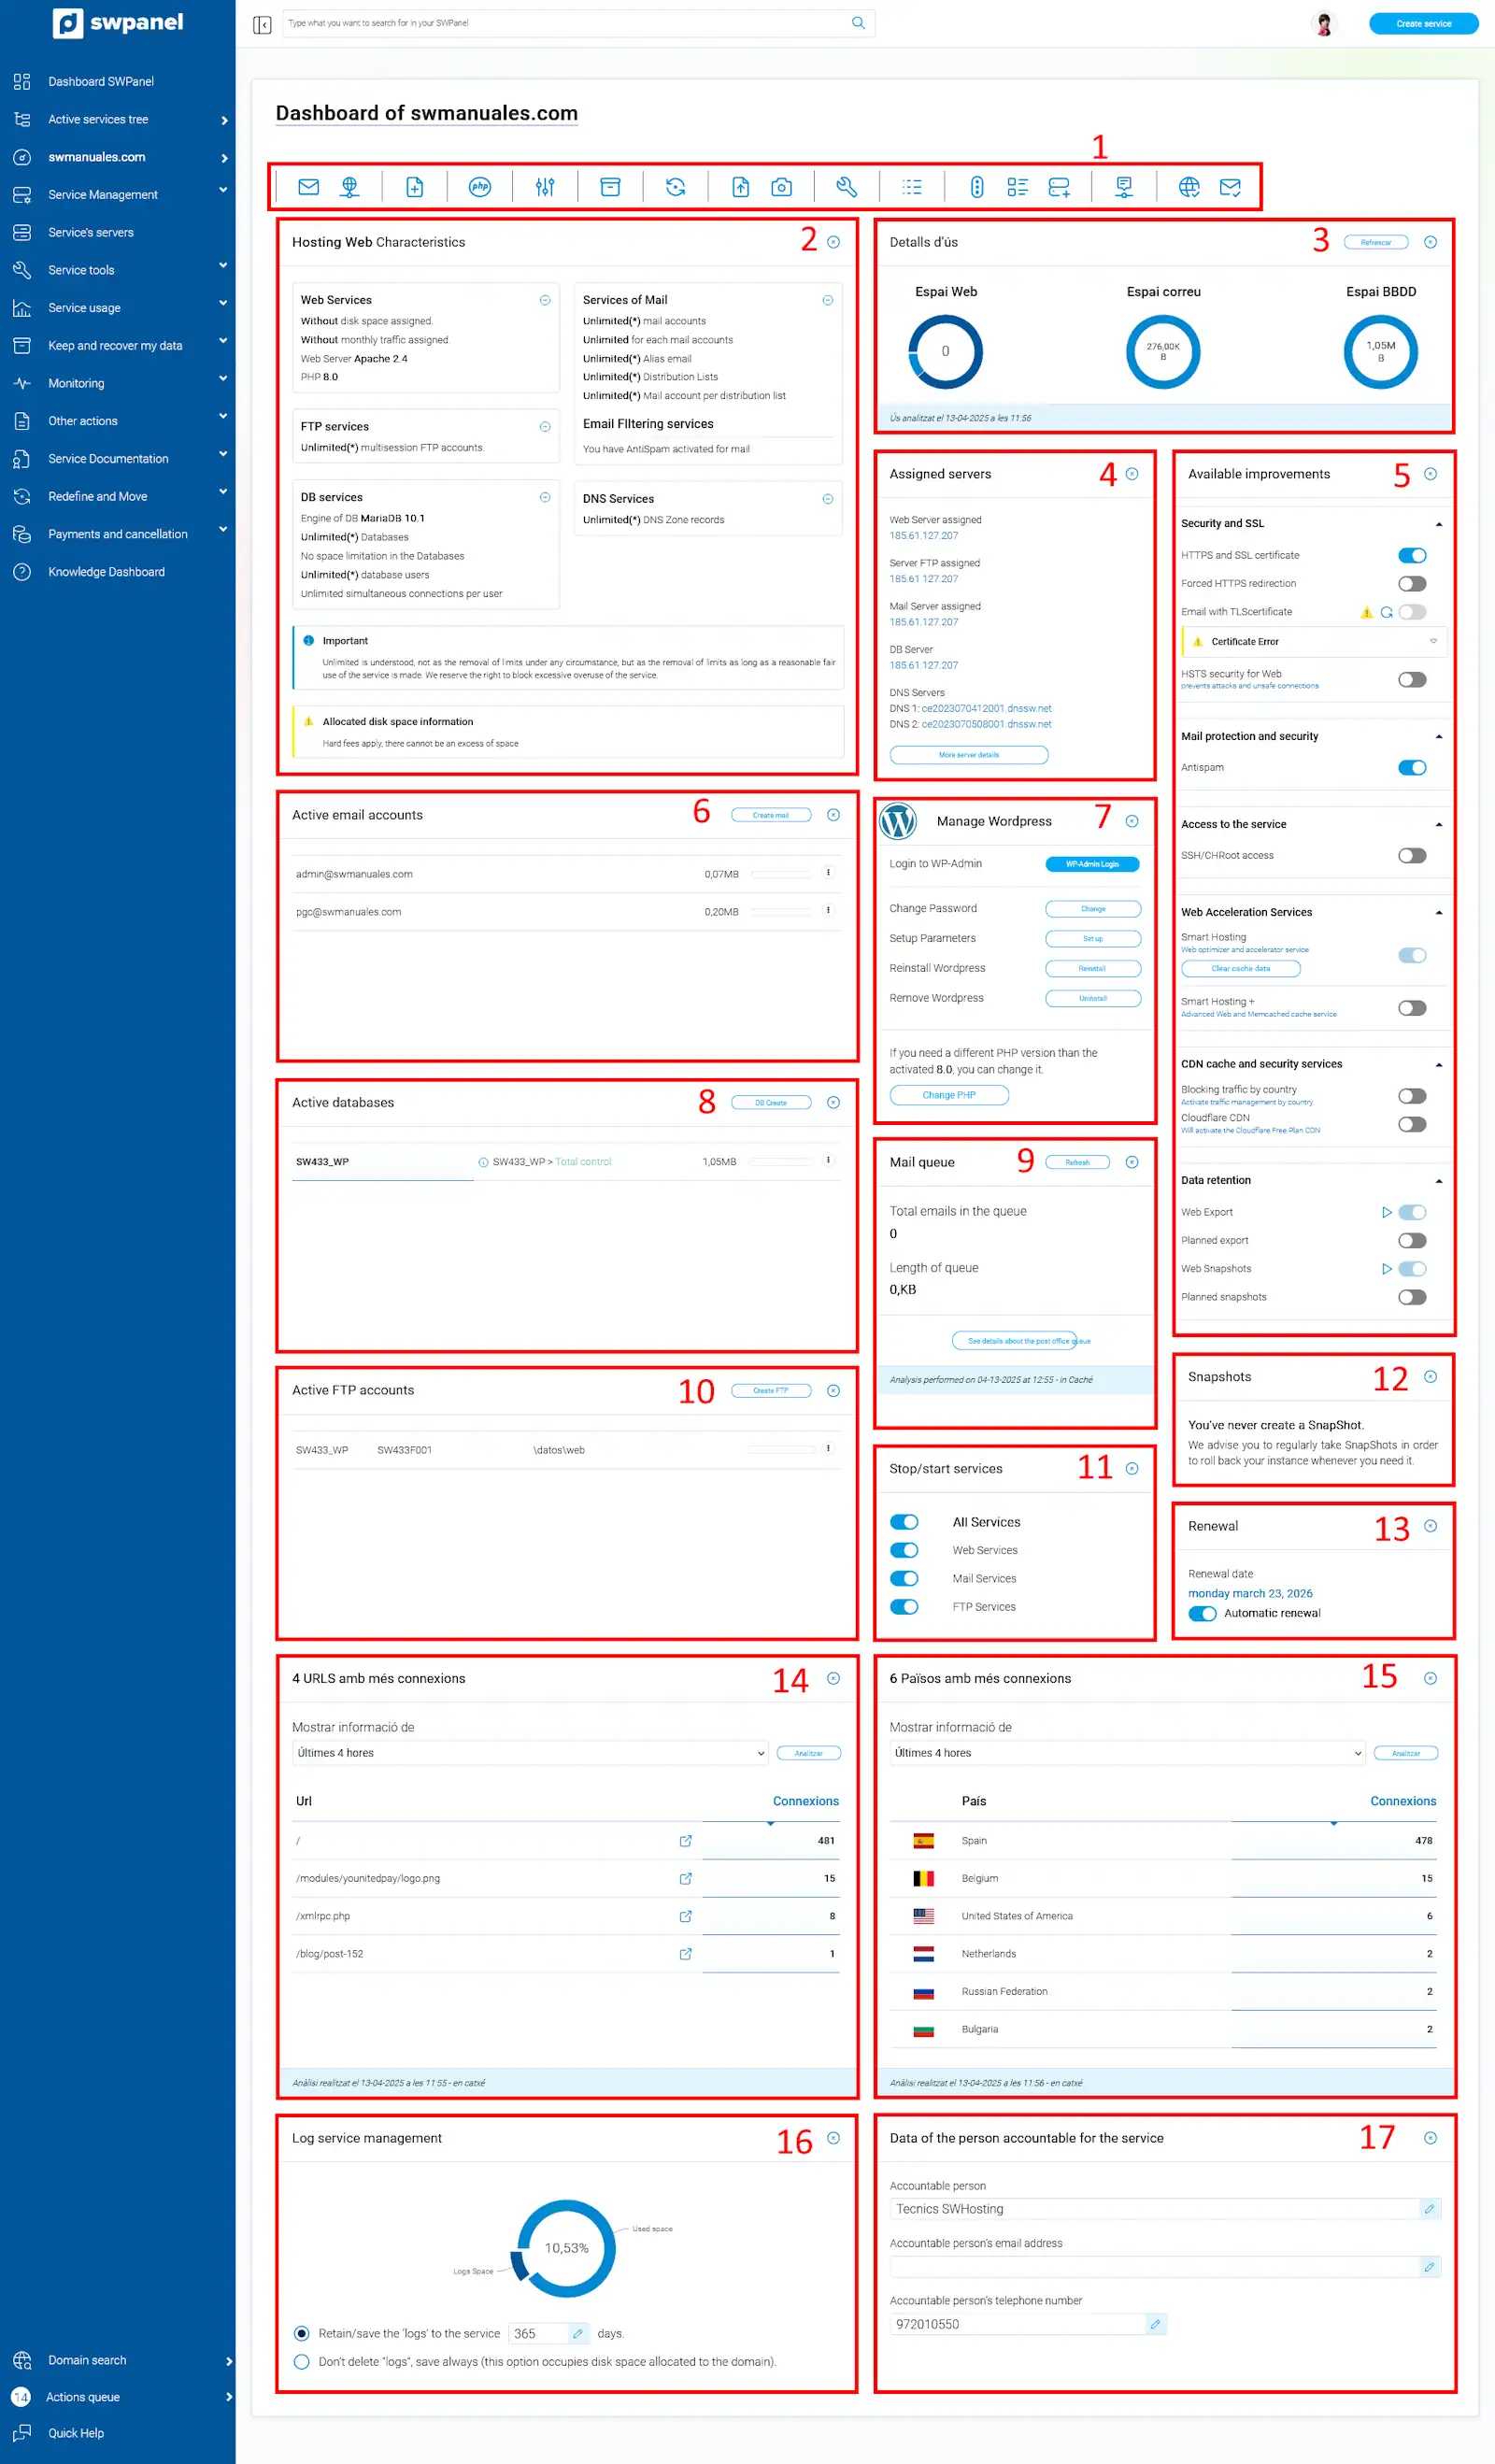
info_capture The screenshot is for guidance purposes. It was taken on version 2025.03.0007 dated 12/04/2025. It may differ from what the current version of SWPanel shows
Dashboard blocks Hosting
1. Configuration icons
In this block you will find the icons corresponding to the following functions:
-
Create Email Account: To go directly to create a new email account within your Hosting.
-
Create FTP Account: To go directly to create a new FTP account within your Hosting.
-
Create new website: To create a new website on your Hosting, either a new Hosting plan or an alias.
-
Show PHP Info: To see all the information regarding the PHP version installed on your Hosting.
-
Adjust the parameters and add-ons of your Hosting plan: To customize the software or services installed on the service.
-
Restore backup of this domain: If you have backup copies activated in the Hosting, you will be able to restore a copy of your website, databases or email by accessing this section.
-
Change the hosting plan assigned to this service: To change to a higher plan or change the servers assigned to the service.
-
Export the website now: Export your website by email or to an external FTP server.
-
Take a SnapShot of the website now: This is done in real time and copies the website and database content. It does not include email or logs.
-
Adjust basic parameters: To modify Nginx web server parameters and the service's PHP configuration file.
-
Manage service logs: To view access and error events for your Hosting.
-
Permissions manager: To manage read/write permissions for your Hosting service.
-
File manager: To explore and perform actions directly on the directories and files of your Hosting service.
-
Re-create the Web Server's Virtual Host files.: This option is useful when you need to regenerate the Virtual Host file for your website.
-
Timeline of actions on this service: To see all the actions that have been performed on the service sorted by day of execution.
-
Check the functioning of the website: From this section you can check your website to make sure everything is working correctly, and see how to solve any problems you may have.
-
Check email functionality: From this section you can check your email accounts to make sure everything is working properly, and see how to solve any problems you may have.
2. Web Hosting Features
Complete technical information on the configuration of the service.
3. Usage Details
Shows the current consumption of web space, databases and emails.
4. Assigned Servers
Display of the active servers providing the Hosting service.
5. Available Upgrades
Optional additional features to activate or deactivate.
6. Active email accounts
Editable list of configured email accounts.
7. CMS management
Automated installation of content management systems such as WordPress, Joomla, etc.
8. Active databases
Editable list of active databases in the hosting.
9. Email queue
Undelivered emails and the space they occupy.
10. Active FTP accounts
Editable list of available FTP accounts.
11. Stop/Start services
Control to activate or deactivate Hosting services.
12. Snapshots
Management of Snapshots made on the Hosting (if activated).
13. Renewal
Display of renewal date and auto-renewal configuration.
14. URLs with the most connections
Web pages within the Hosting service that receive the most traffic.
15. Countries with the most connections
Geographical distribution of website visitors.
16. Log management
Service log retention configuration.
17. Service manager
Display and edit the name, email and telephone number of the technical manager.