
How to review the event log (logs) of your website
To check the event log of your website, you can follow these steps:
1- Access SWPanel and go to the Dashboard of the corresponding service, using the search bar located at the top.
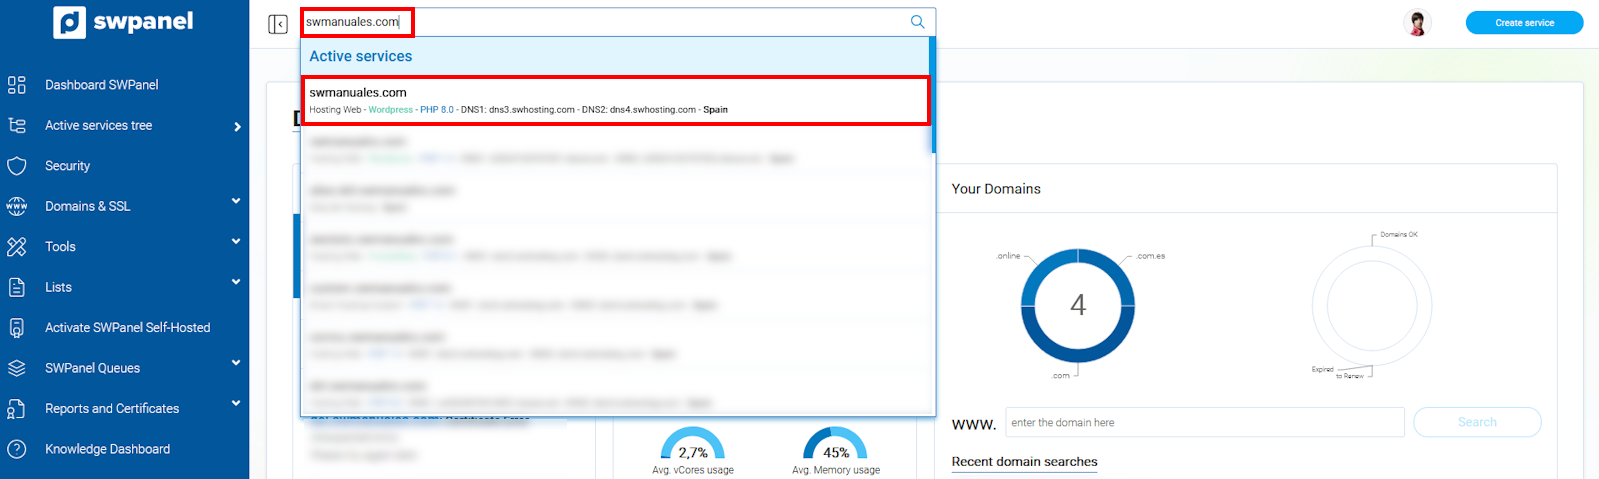
info_capture The screenshot is for guidance purposes. It was taken using version 2025.00.0017 dated 03/01/2025. It may differ from what the current version of SWPanel shows.
2- Once you are in your service's Dashboard, go to the LOG Manager using the LOGs icon.
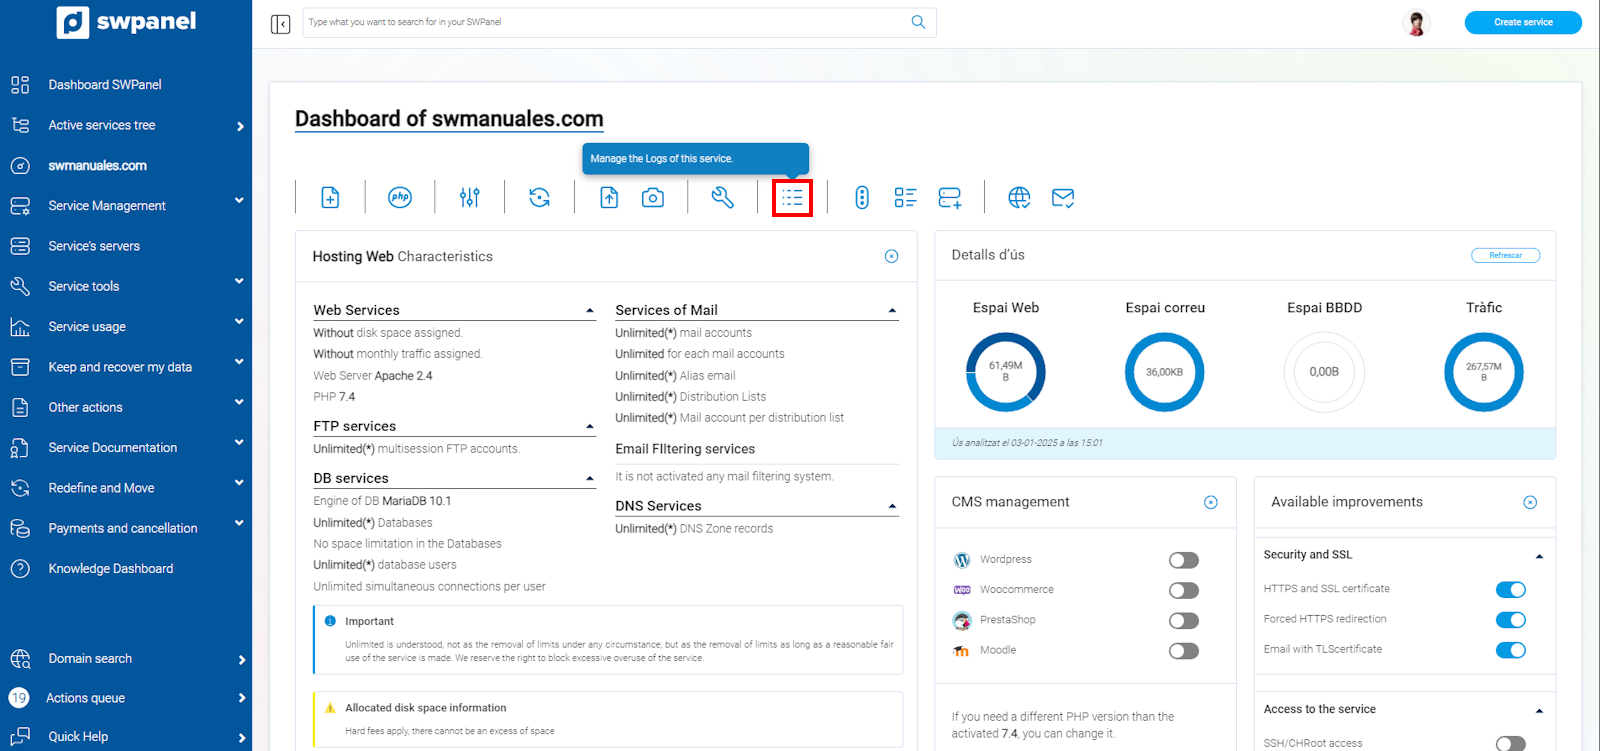
info_capture The screenshot is for guidance purposes. It was taken using version 2025.00.0017 dated 03/01/2025. It may differ from what the current version of SWPanel shows.
Then you will see four different types of files: Apache Access, Apache Error, Nginx Access, and Nginx Error:
-
apache_access_XXXXXXXX.log - The server stores information about all requests it processes, the location of the log file, and the content recorded in the access log
-
apache_error_XXXXXXXX.log- The Apache error log is where information about any error or anomaly encountered is recorded. Many of the 'errors' in Apache logs are usually minor, such as a visitor requesting a file that does not exist. Apache also uses error logs to record warnings that may indicate a potential problem with a particular event or configuration.
-
nginx_access_XXXXXXXX.log - In this file, you will see the requests that the Nginx service has made against your web service. (cache)
-
nginx_error_XXXXXXXX.log - The server stores information about all failed Nginx service requests against your web service in this error log
The way to view any of the 4 types of logs we have just mentioned is the same as indicated in the following example.
3- Select the dropdown menu [...] and select 'Download' or 'View Log from SWPanel'. If the log file is too large, the 'View Log from SWPanel' option will not be available.
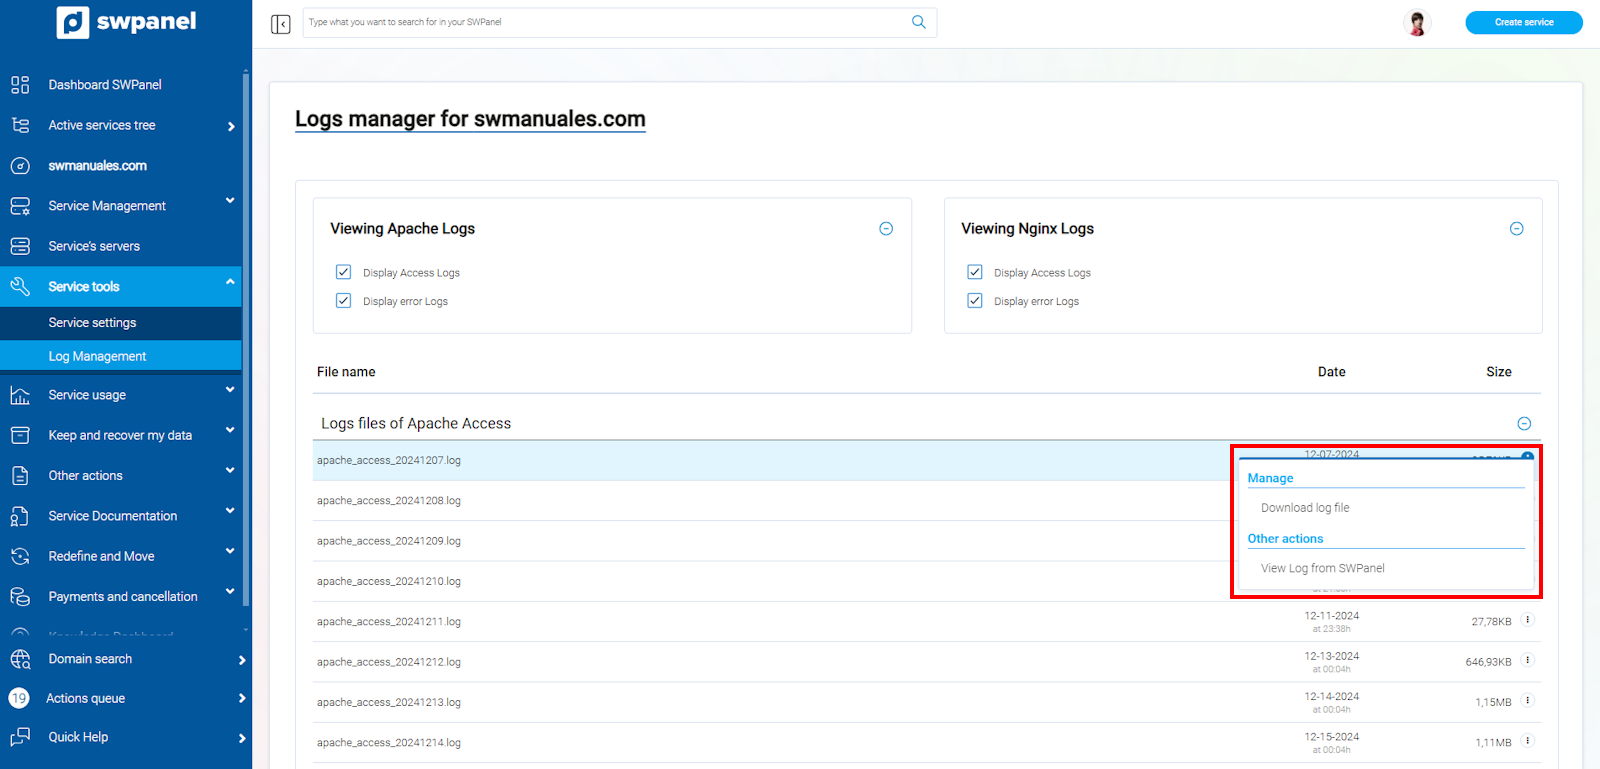
info_capture The screenshot is for guidance purposes. It was taken using version 2025.00.0017 dated 03/01/2025. It may differ from what the current version of SWPanel shows.
4- If you open it through SWPanel, it will look similar to this.
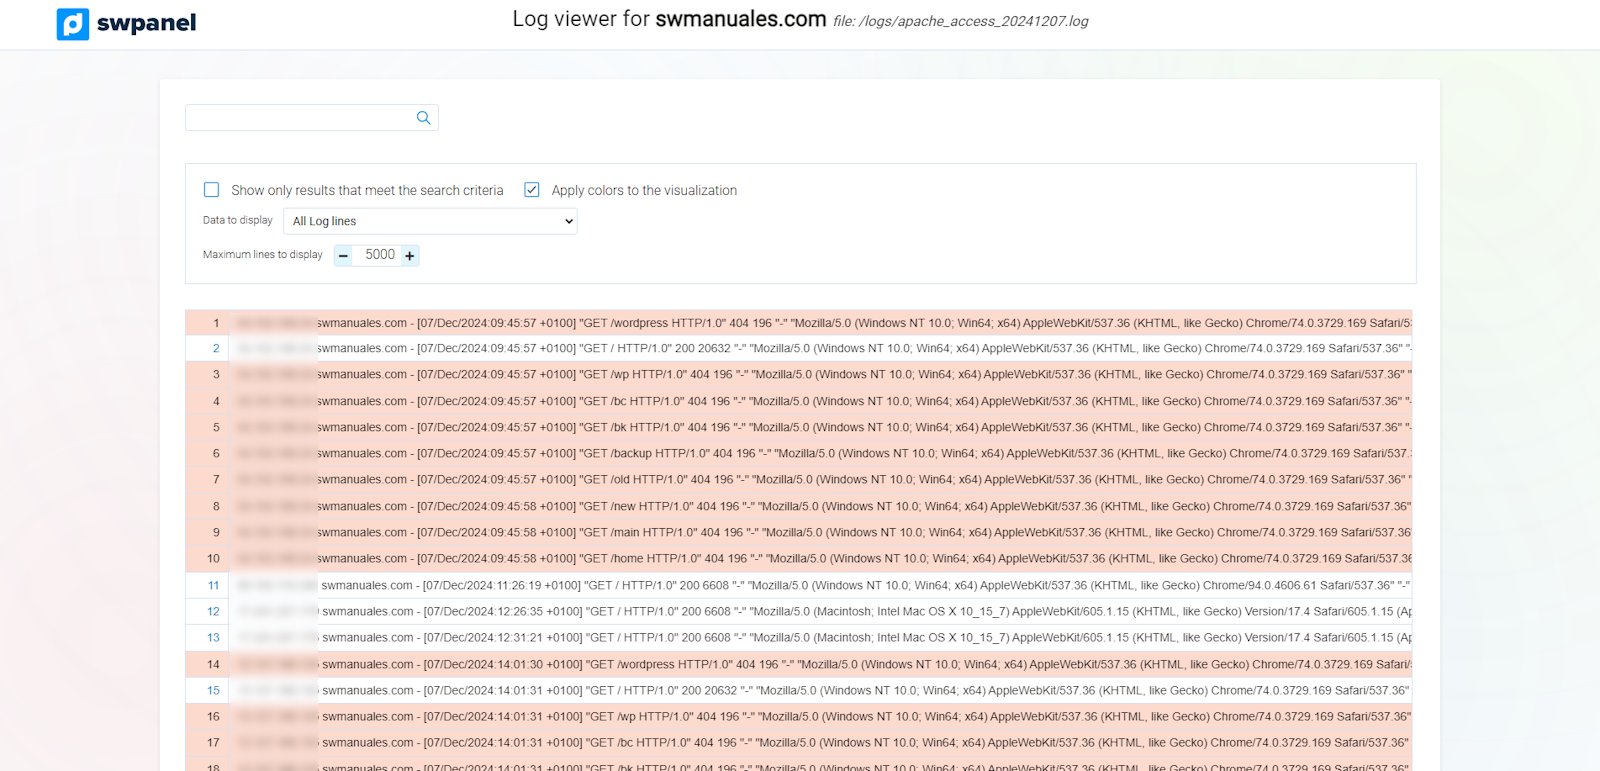
info_capture The screenshot is for guidance purposes. It was taken using version 2025.00.0017 dated 03/01/2025. It may differ from what the current version of SWPanel shows.
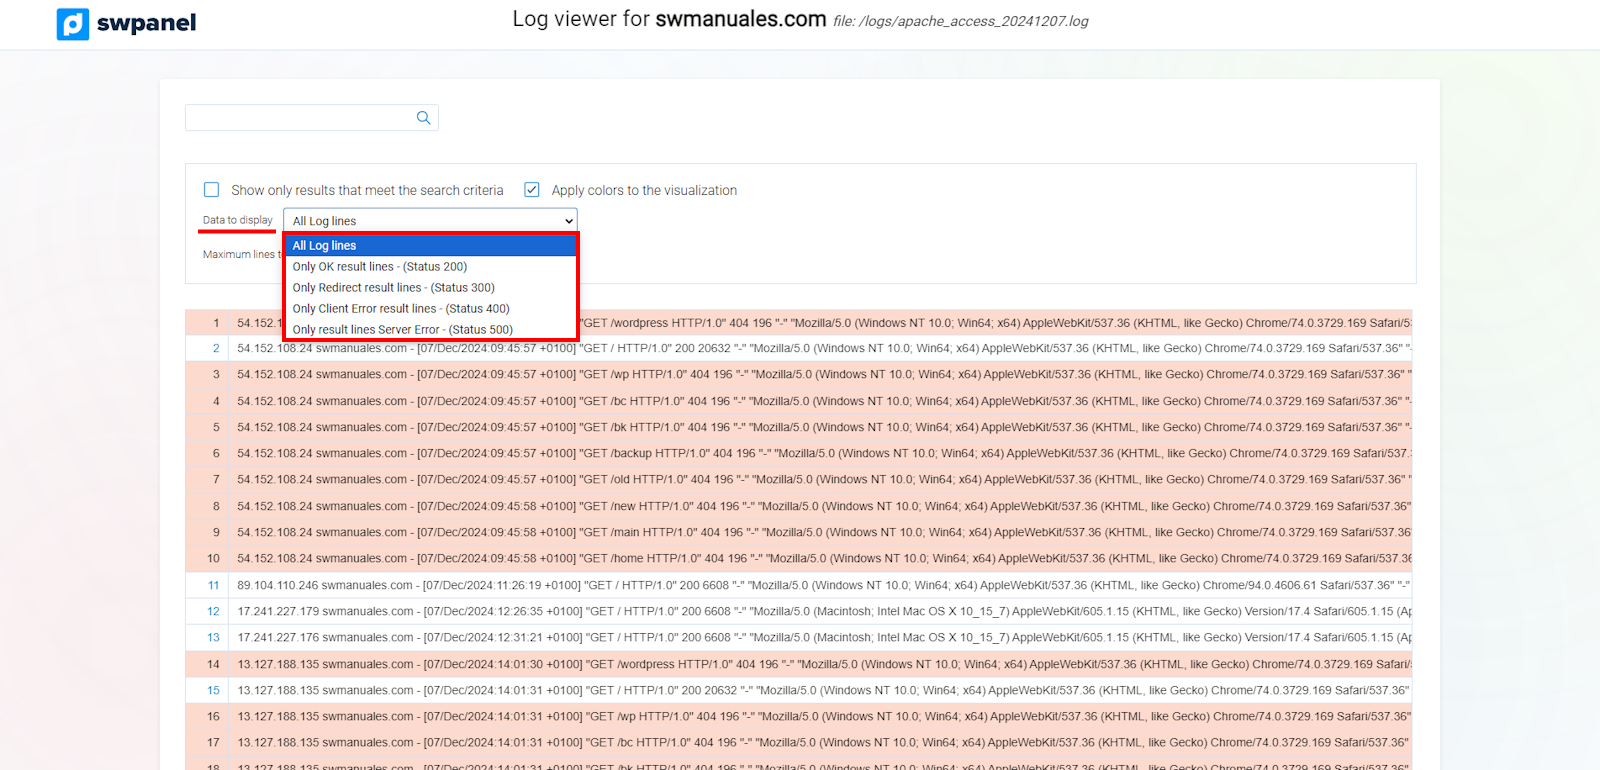
5- In the 'Data to visualize' option, you can choose from the following options to filter and search only for the specific code.
info_capture The screenshot is for guidance purposes. It was taken using version 2025.00.0017 dated 03/01/2025. It may differ from what the current version of SWPanel shows.
-
All Log lines: --> Default option.
-
Only Ok Result lines - (Status 200) --> Filters only the lines containing status 200, the request was successful
-
Only Redirect Result lines - (Status 300) --> Filters only the lines containing status 300, equivalent to redirects.
-
Only Client Error Result lines - (Status 400) --> Filters only the lines containing status 400, equivalent to client errors.
-
Only Server Error Result lines - (Status 500) --> Filters only the lines containing status 500, equivalent to server errors.
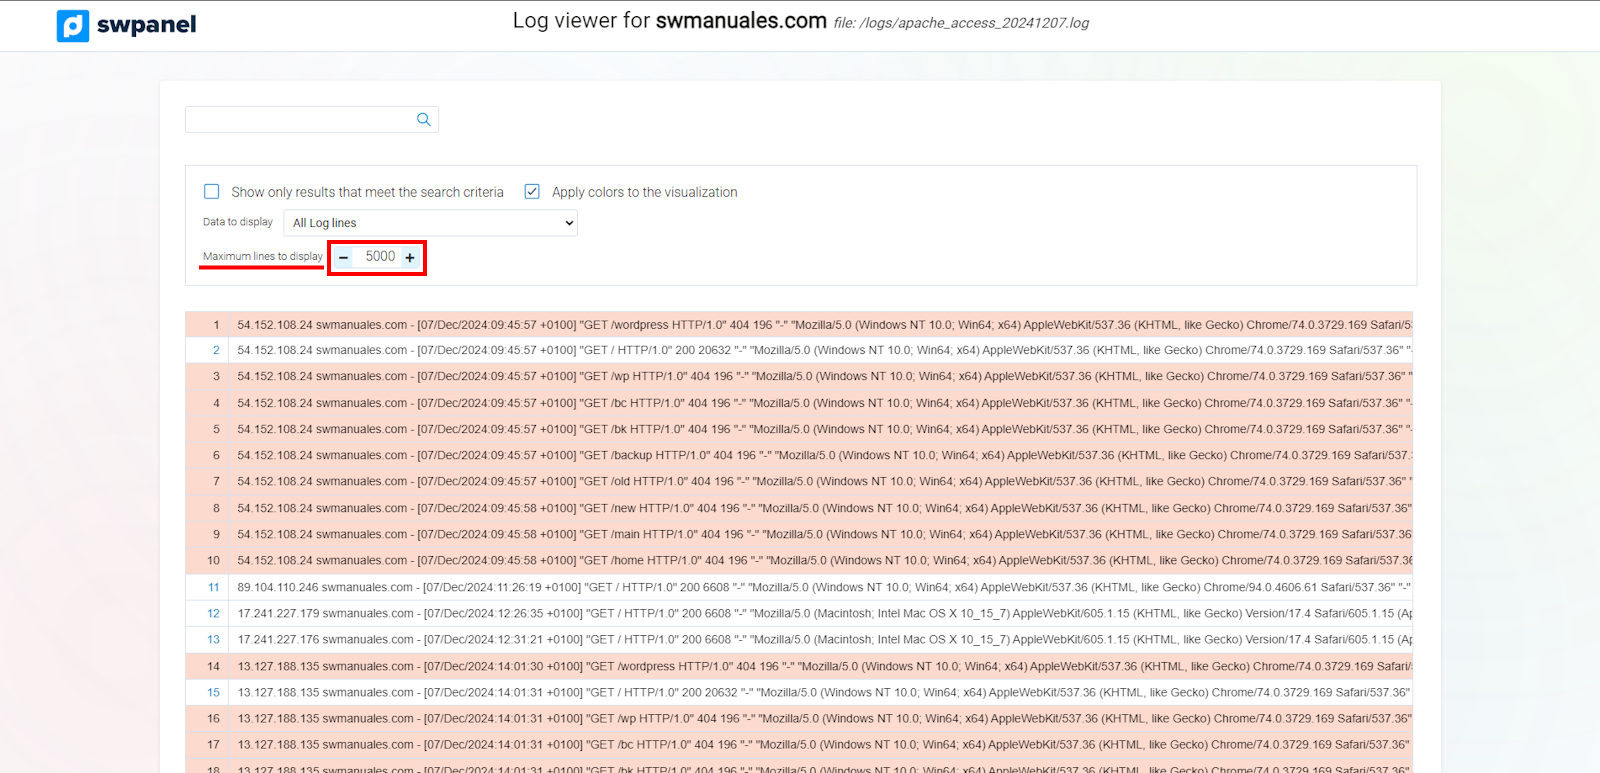
6- You can also choose the maximum number of lines to visualize; the default is 5000, although you can modify it. Just type the number of lines you want in the box and press the 'Enter' button.
info_capture The screenshot is for guidance purposes. It was taken using version 2025.00.0017 dated 03/01/2025. It may differ from what the current version of SWPanel shows.
If you have any questions regarding this, feel free to use our support wall. ? Manual: Talk to support with Quick Help