How do I know the cost of my Cloud server?
Sometimes it is difficult to know what the amount of the invoice will be for your Cloud server, and more if you have increased or reduced resources during the active period.
First, you must access your SWPanel , and through the search engine, indicate the desired service:
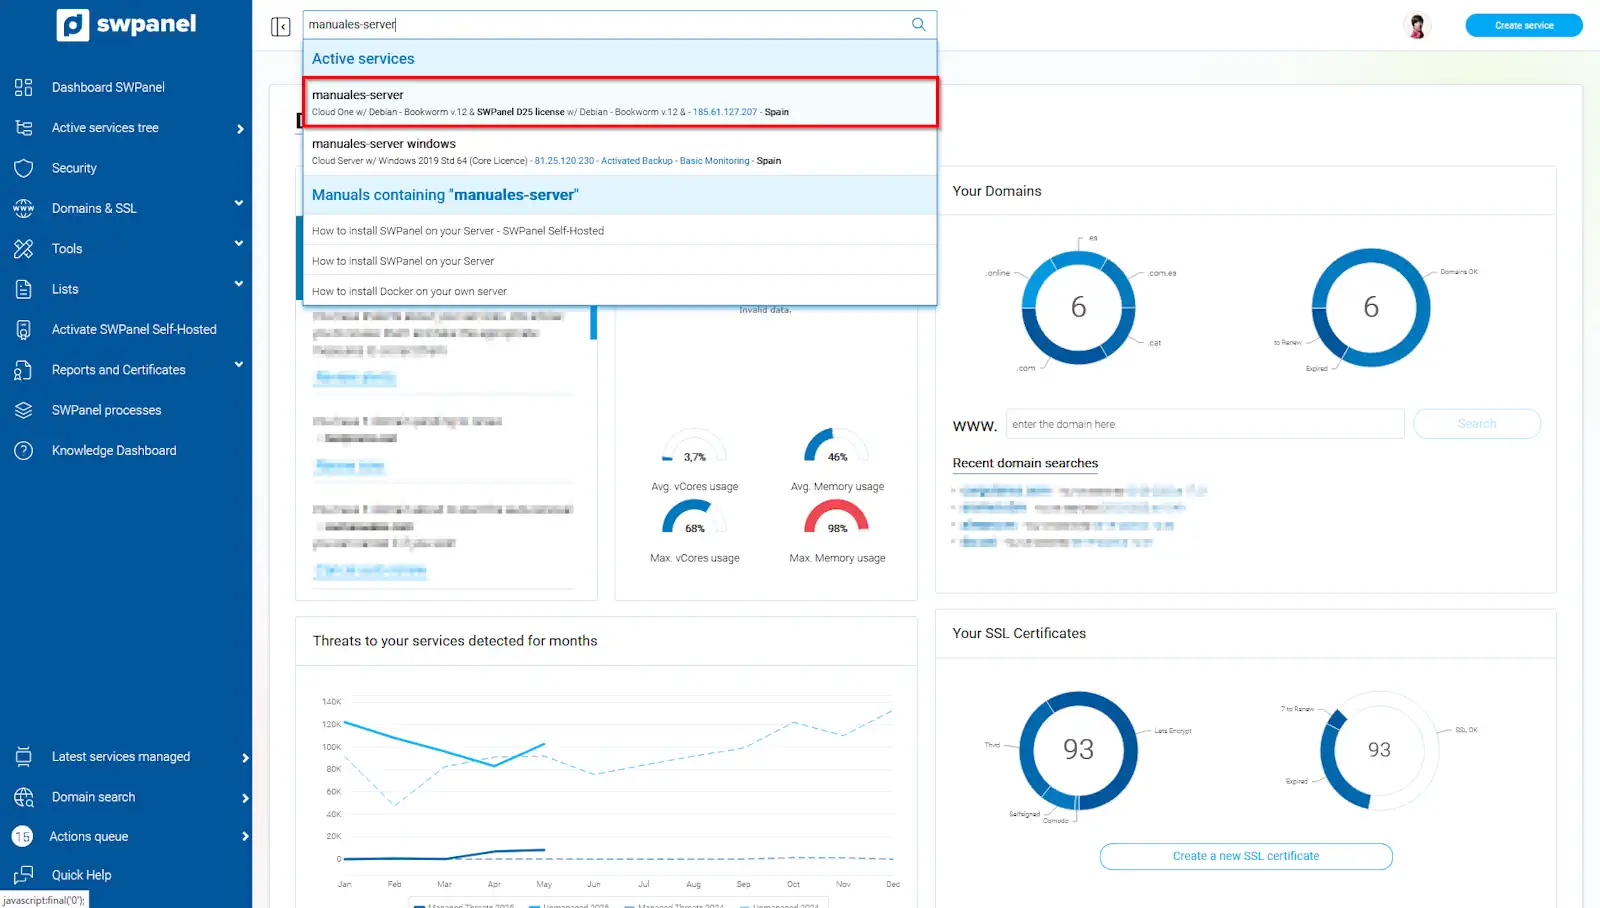
info_capture The screenshot is for illustrative purposes only. It was taken from version 2025.004.0002 dated 29/05/2025. It may differ from what is shown in the current version of SWPanel.
In the Dashboard of the service, you will see an information box called Current period usage. Click on See invoice simulation
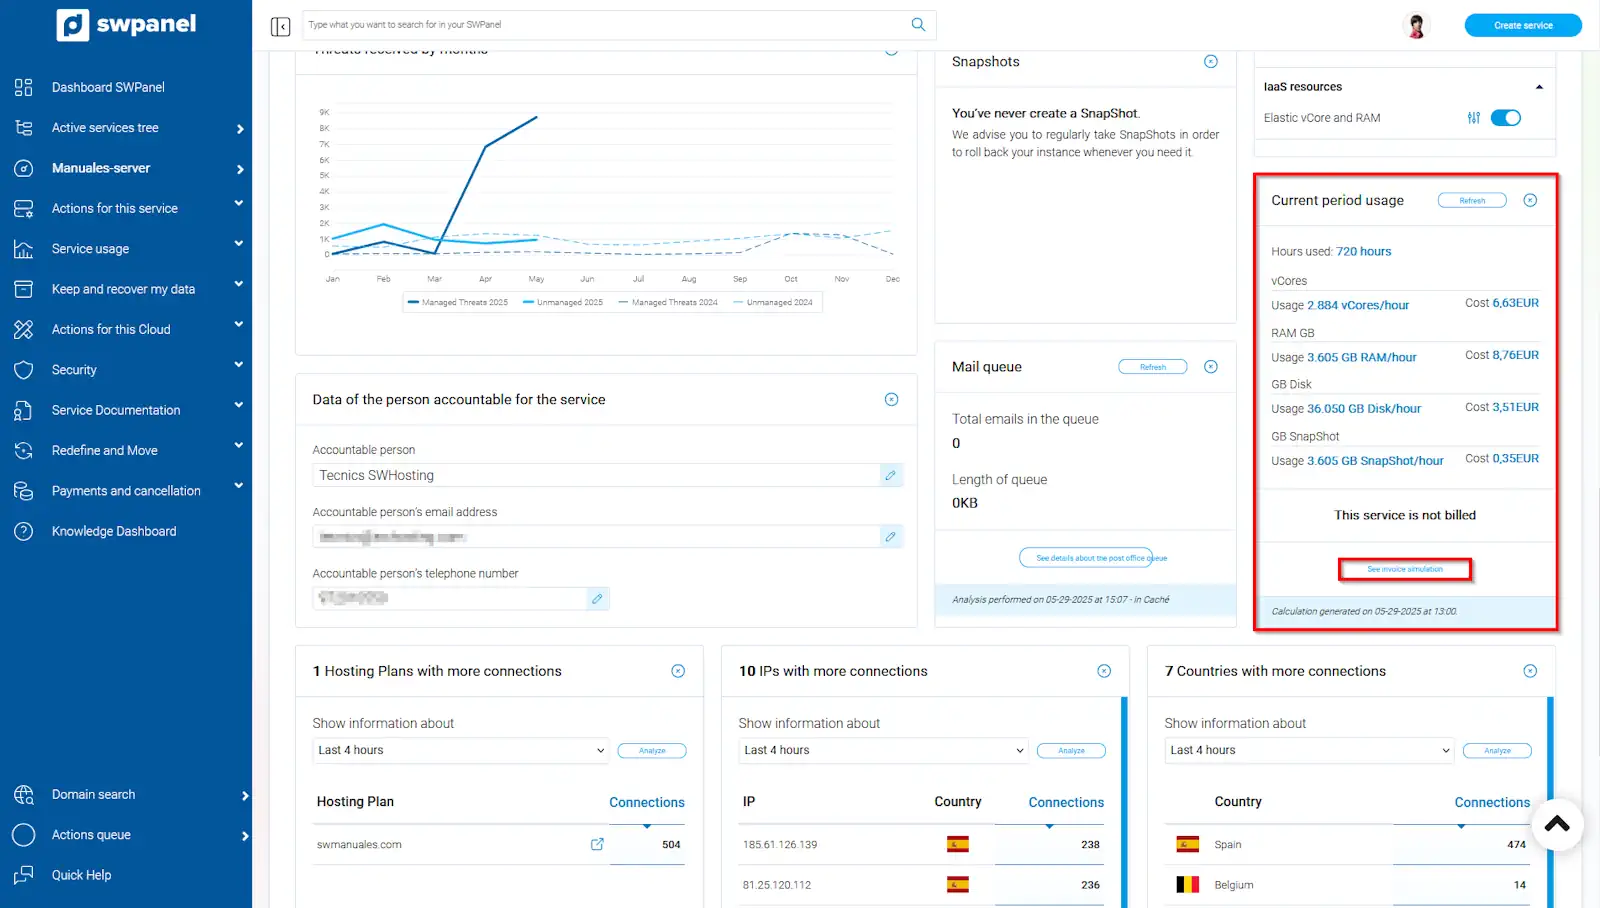
info_capture The screenshot is for illustrative purposes only. It was taken from version 2025.004.0002 dated 29/05/2025. It may differ from what is shown in the current version of SWPanel.
In the first tab, you will see the Invoive simulation for the period. You can do the Real cost calculation and the Period cost estimate
Invoive simulation for the period
a) Real cost calculation The system calculates the cost of the resources consumed from the date of registration of the server to the current date of the query. If you cancel the server that same day, this would be the real cost of your Cloud service
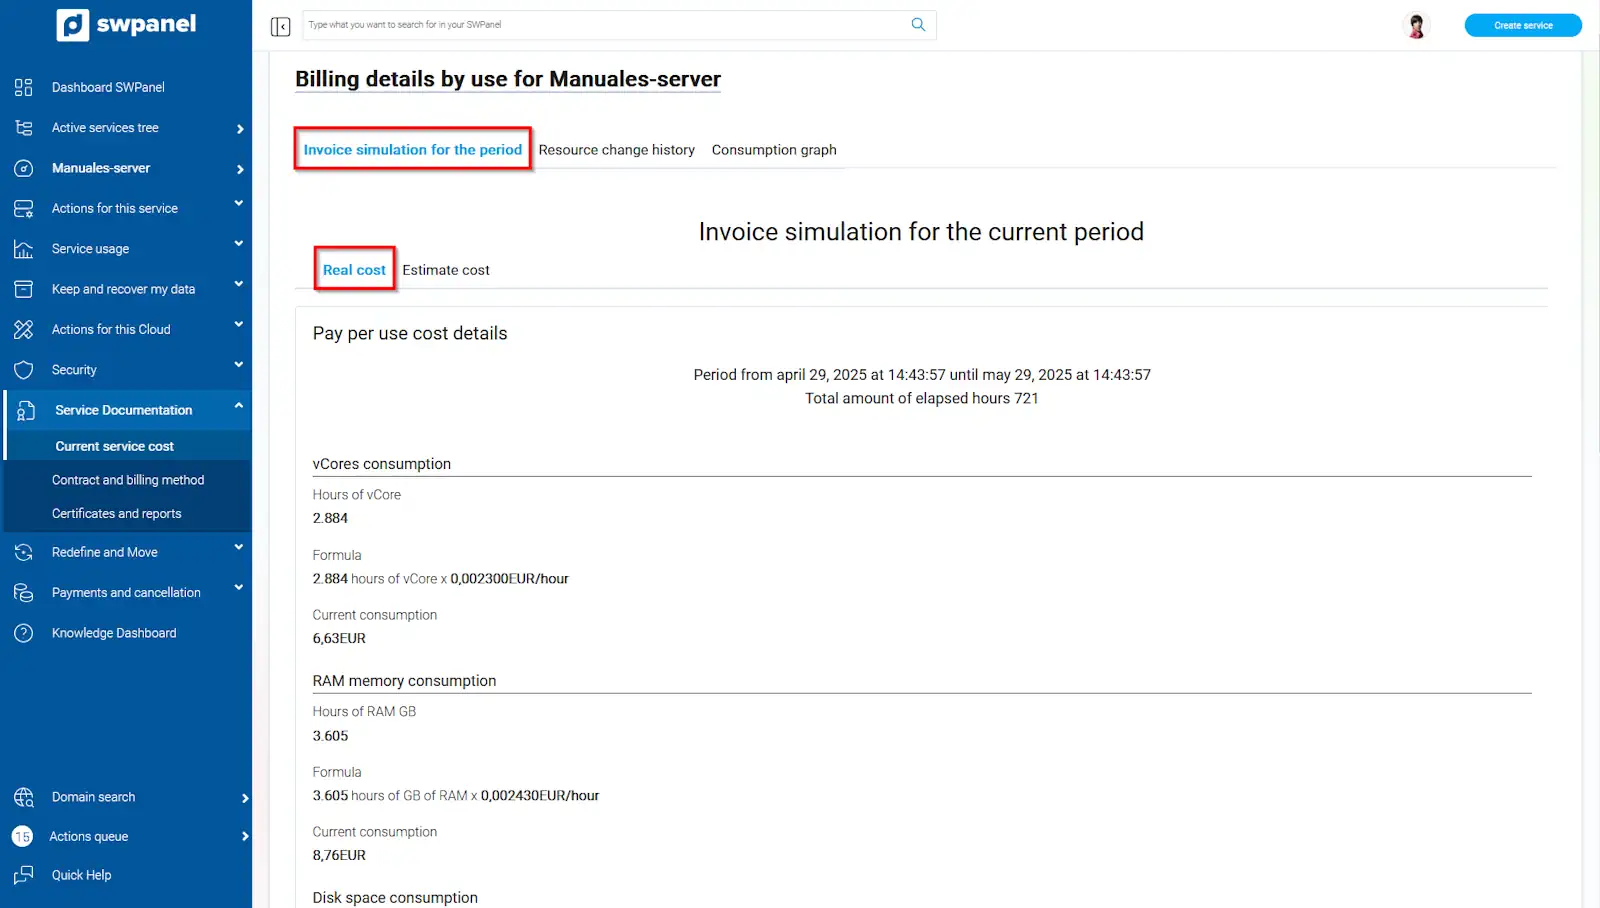
info_capture The screenshot is for illustrative purposes only. It was taken from version 2025.004.0002 dated 29/05/2025. It may differ from what is shown in the current version of SWPanel.
b) Period cost estimate
The system calculates the estimated cost of your Cloud service at the end of the period. That is, from the date of discharge of the service, until its renewal date (period of 1 month). When your invoice is generated, this will be its amount, as long as you do not modify your Cloud resources until the renewal date.
If you increase or reduce resources, your bill will vary.
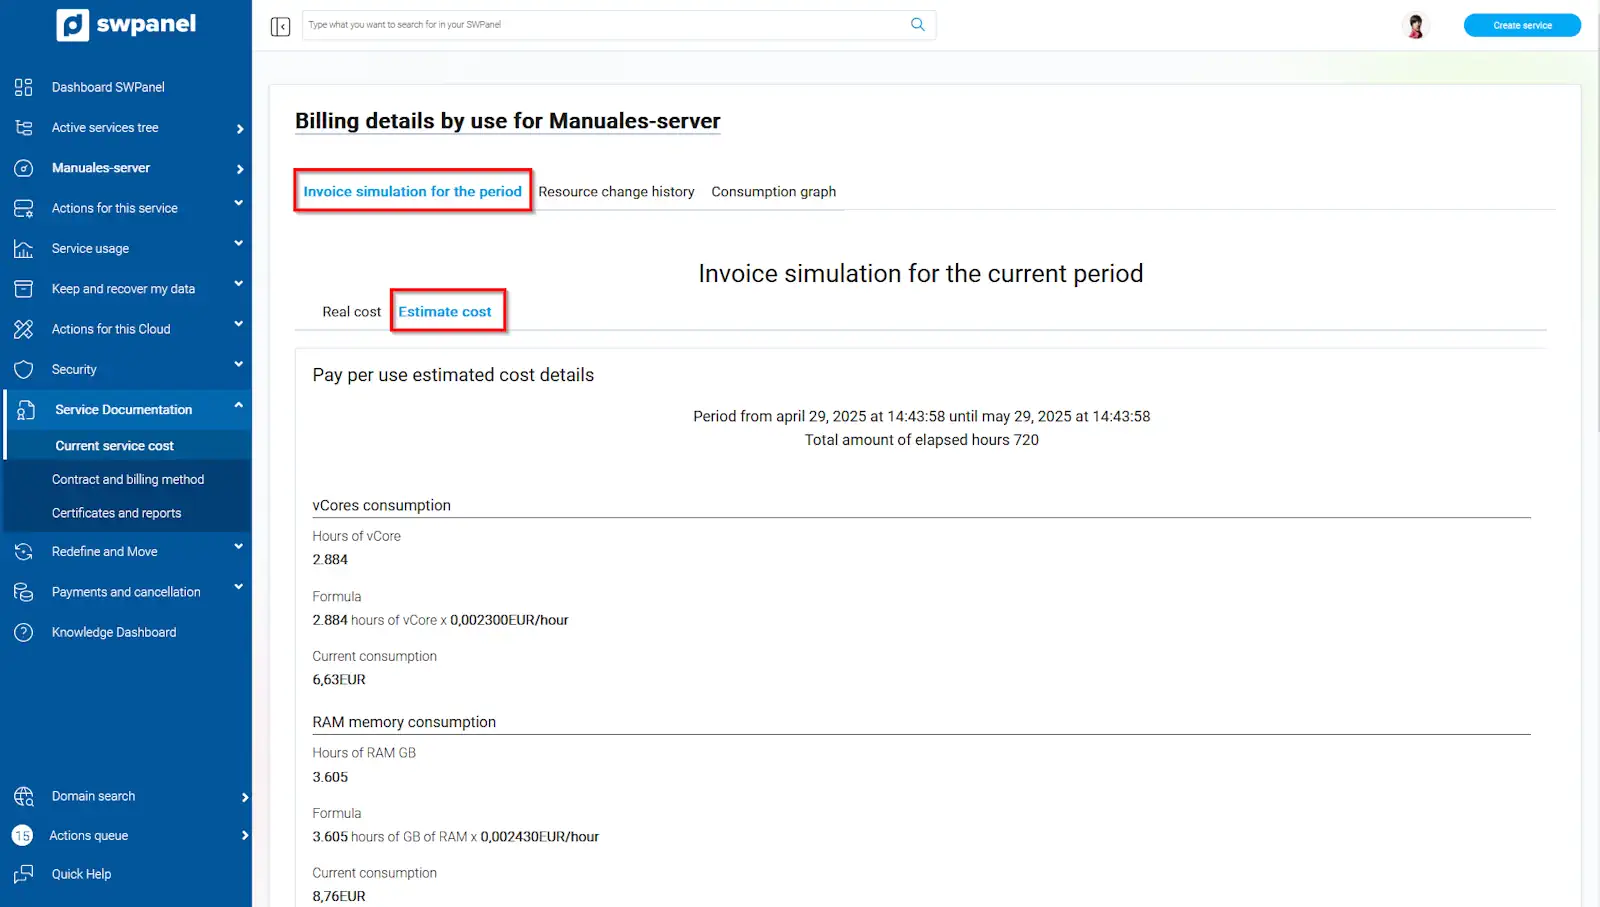
info_capture The screenshot is for illustrative purposes only. It was taken from version 2025.004.0002 dated 29/05/2025. It may differ from what is shown in the current version of SWPanel.
Resource change history
In this tab you will see all the variations that you have made throughout the life of the server, the increases (in green) and reductions (in red) of all the contracted resources
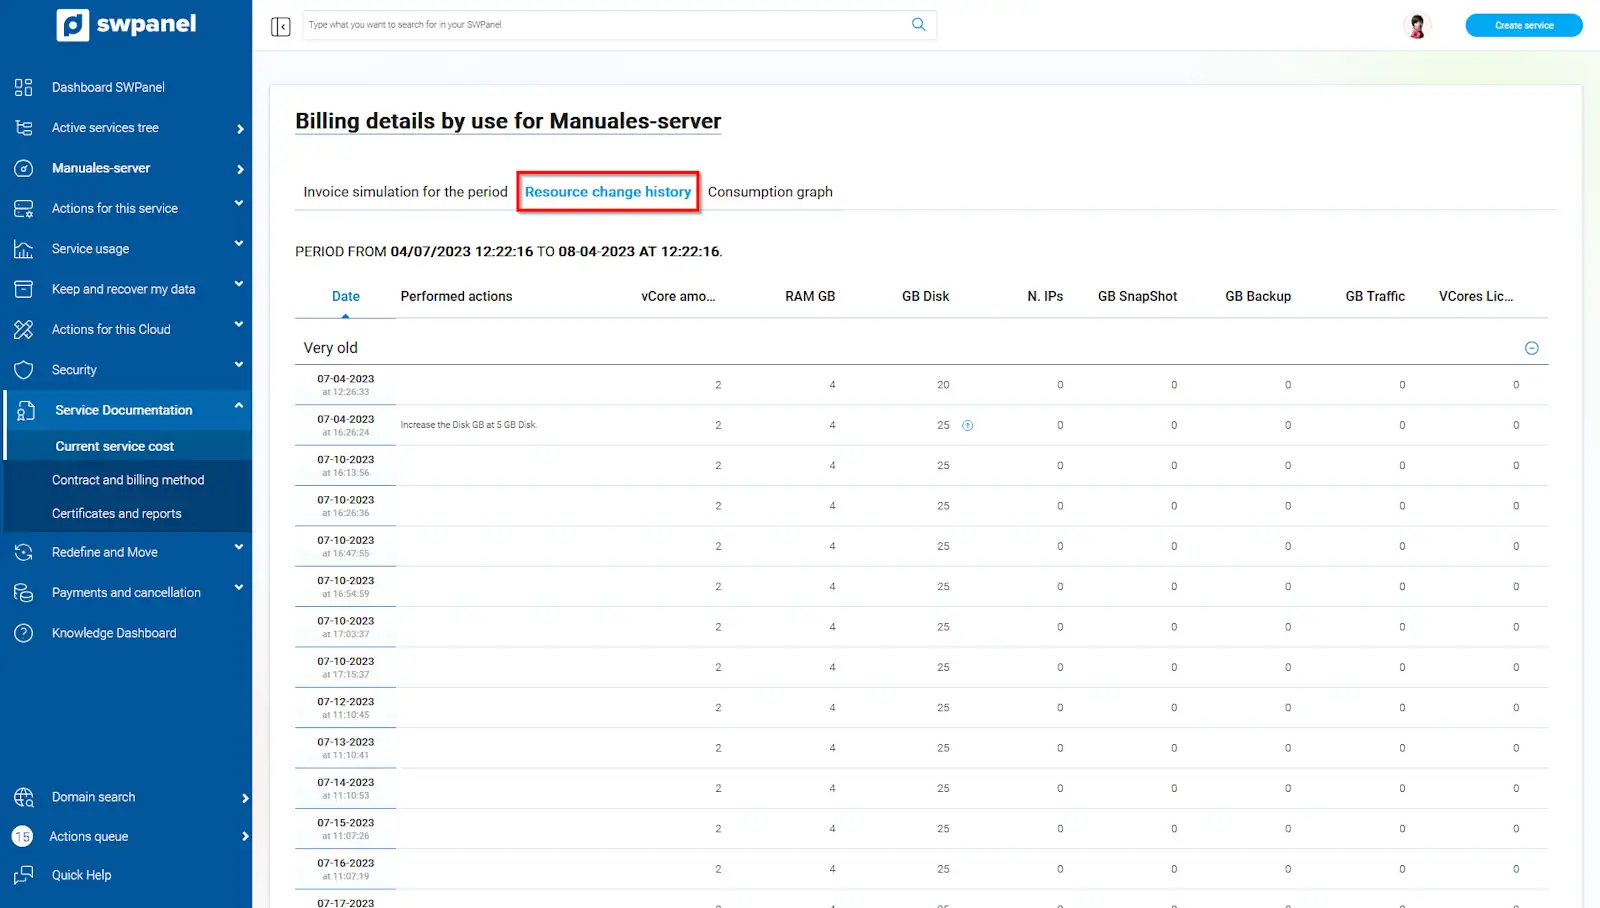
info_capture The screenshot is for illustrative purposes only. It was taken from version 2025.004.0002 dated 29/05/2025. It may differ from what is shown in the current version of SWPanel.
Consumption graph
From this section you can also see the variations in resources of your cloud server but reflected in a graph, in order to have a more visual capture of the increases and reductions in resources.
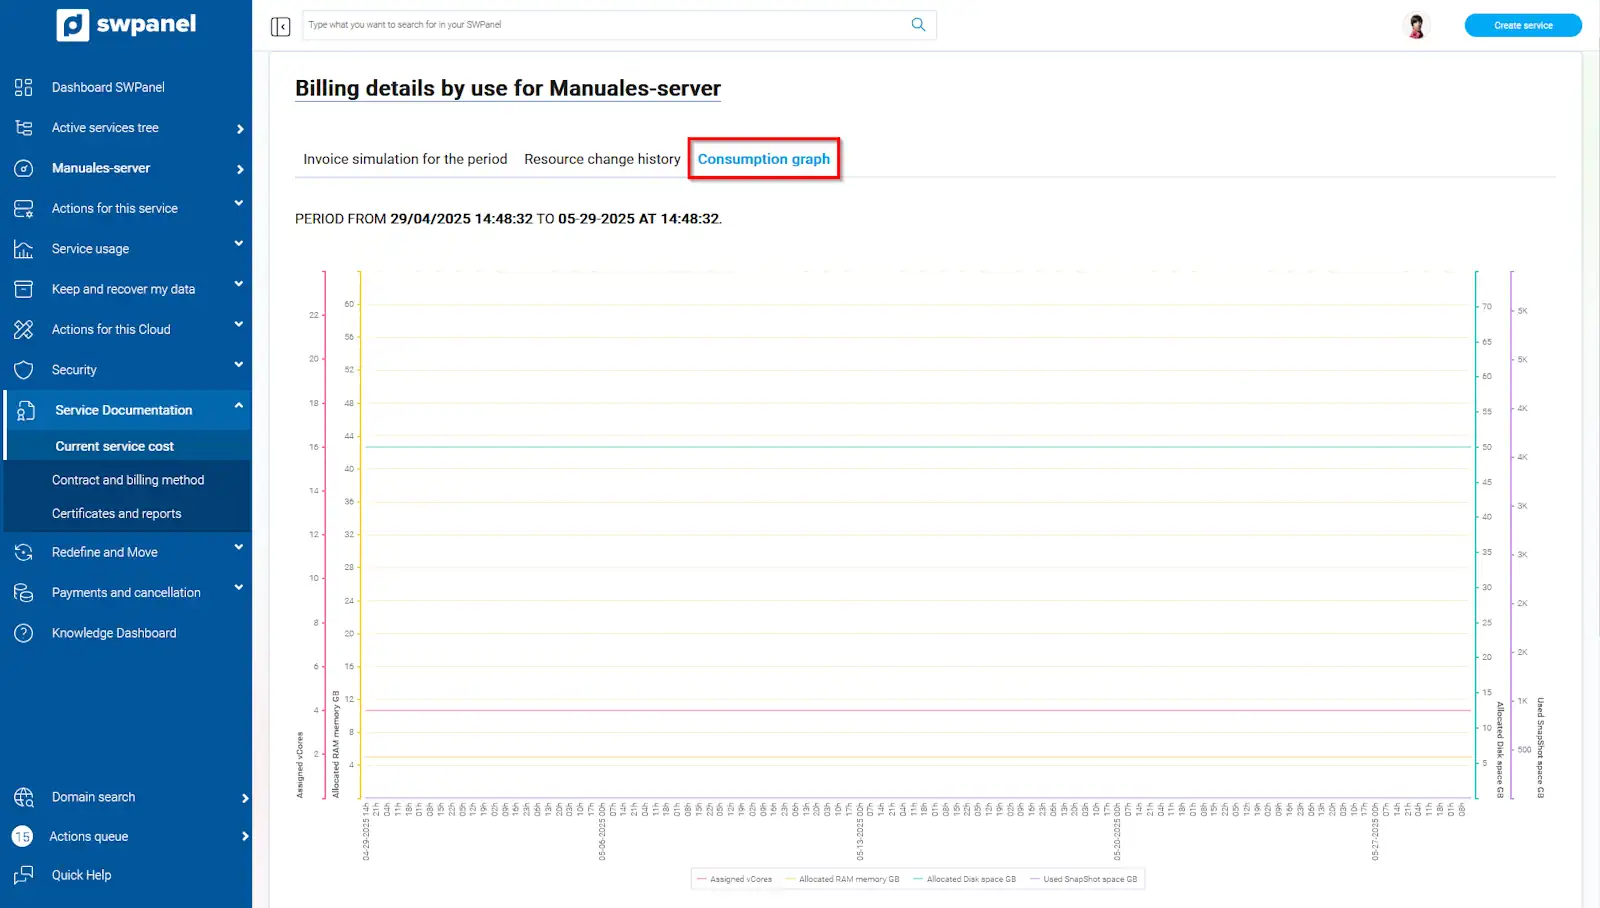
info_capture The screenshot is for illustrative purposes only. It was taken from version 2025.004.0002 dated 29/05/2025. It may differ from what is shown in the current version of SWPanel.